What are logs — and why your console.log prints somewhere else
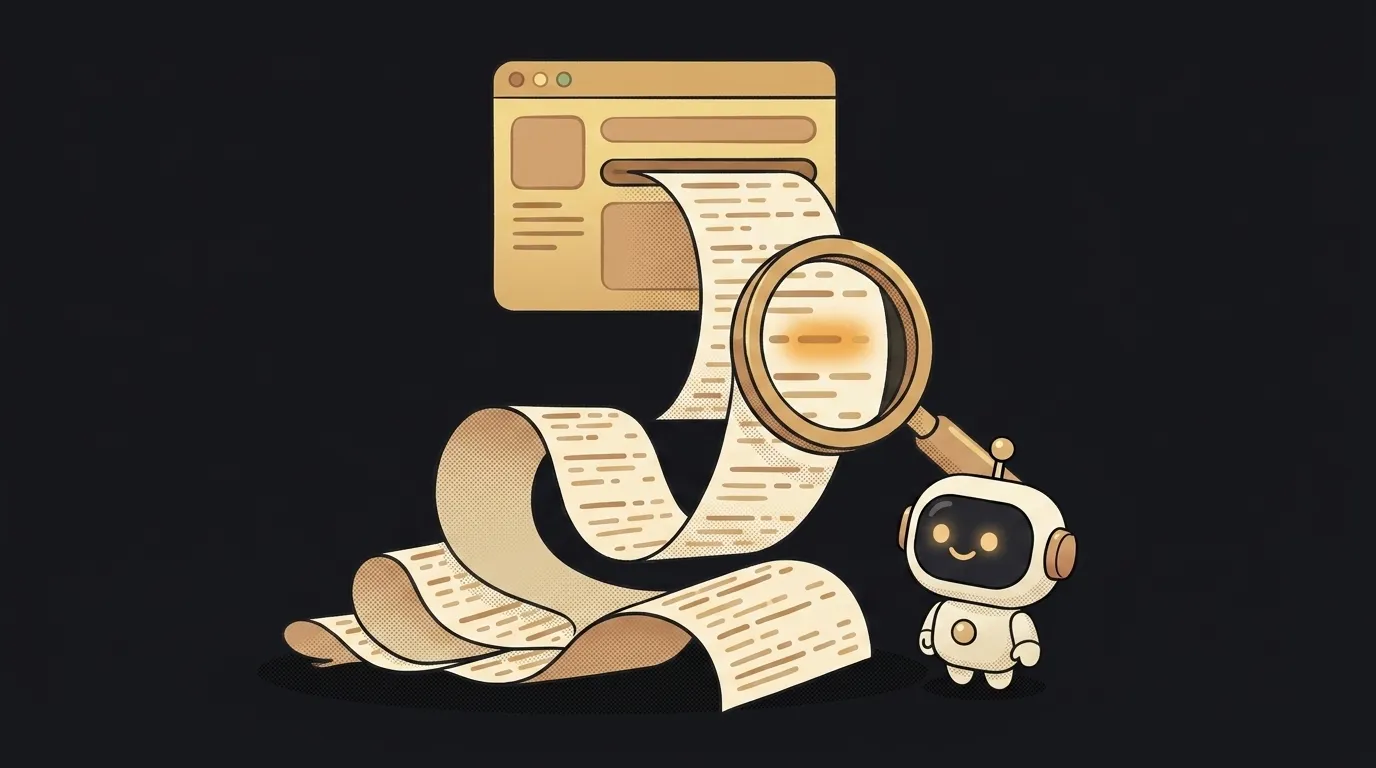
A familiar trap: you add console.log("it works!") to your server code, open the site, click the button — and the browser console is silent. First thought: the code never runs. But it does run. The log isn't lost — it printed in a different room.
This is the number one secret about logs, and beginners lose hours to it. Let's break down what logs are, where each "room" physically is — and why a couple of log lines fix a bug faster than shouting "nothing works."
What logs are, in plain words
Logs are your program's diary. While it runs, it prints lines: "started," "request came in," "couldn't connect to the database." Each line is an event with a timestamp.
A program has no other way to tell you what's happening to it. The screen is for the user. The logs are for you.
Diary lines come at different volumes: regular notes (info), warnings (warn), and errors (error). The red lines are errors — and that's where any debugging starts.
Where to read them — the one-room rule
The rule is simple: a log prints where the code lives. Not where you're looking — where the code executes. That gives you three rooms:
- Frontend code lives in the browser — so it prints to the browser console. Open it with F12 (or right click → Inspect), the Console tab. Your button clicks and page errors land here.
- Server code lives in the terminal where you started it. A
console.loginside an API route shows up right there — in the window runningnpm run dev. It will never appear in the browser. - Hosted code lives on someone else's machine — so it prints to the hosting dashboard. Vercel, Netlify, and Render all have a Logs tab. Build logs live there too — if your deploy fails, the reason is written in them.
The trap from the intro is now obvious: a server-side log was being hunted in the browser. Wrong room.
How to read logs when everything is red
You open the logs and it's a wall of text. Easy — you don't need to read all of it.
- Find the first red line. Errors often cascade: one real error on top and ten consequences below. Fix the top one.
- In a long error, find your file. The wall of strange paths is a stack trace — the error's route. The line with your file's name is the actual spot.
- Read the message literally. "Cannot connect to database" means exactly that. Half of all errors speak plain human language — if you read them instead of flinching.
Logs + AI: the best debugging duo
Here's where logs truly pay off. "Nothing works" is the worst debugging prompt — the model has nothing to grab onto. The last twenty lines of your log are the best one: they carry the time, the place, and the error text.
The working formula: "Here's what I did → here are the last log lines → why, and how do I fix it?" With that prompt, debugging with AI turns from guessing into diagnosis.
And the reverse trick: can't tell whether the code reaches a certain point — ask AI to place the logs. "Add a console.log at every step of the form handler" — a minute later you can see where the chain breaks.
Is console.log an embarrassing hack?
No. Printing to the log is a legitimate, primary debugging tool at every level. Mature projects just do it in a more organized way — structured logs with levels. The only rule: clean up your noisy debug lines once the bug is caught.
Why are there no logs at all?
Two reasons: the code never reaches your line (check with a log at the very top of the function) — or you're looking in the wrong room. The second one is more common.
Short story-lessons, an agent simulator and daily practice — in our mobile app. Free.