#analytics

Why nobody uses my app — three causes that look identical
Five users on the dashboard is three different diagnoses: they never came, never got through, or never came back. How to tell them apart and fix each.

What is retention — and why the best apps lose users just as fast
Retention is the share of people who come back after N days. The average app loses 77% in three days. Here's how to measure it and what shape the curve should be.

What is a funnel — and why five 80% steps leave you with 33%
A funnel is your user's path, split into steps. Here's why step percentages multiply instead of adding up, and which step to fix first.

What is a cohort — and why your overall metric rises as the product gets worse
A cohort is a group of users who arrived at the same time. Here's why overall averages lie, how to read a cohort table and what to look for in it.

Product analytics vs web analytics — and why GA4 keeps events for two months by default
Web analytics counts pages, product analytics counts people and events. We compare retention, limits and price, and say plainly which one to install.

How to track events in analytics — and why a parameter won't show up on its own
Step by step: how to send a custom event, how to name it, where to verify it in a minute, and why event parameters stay invisible until you register them.
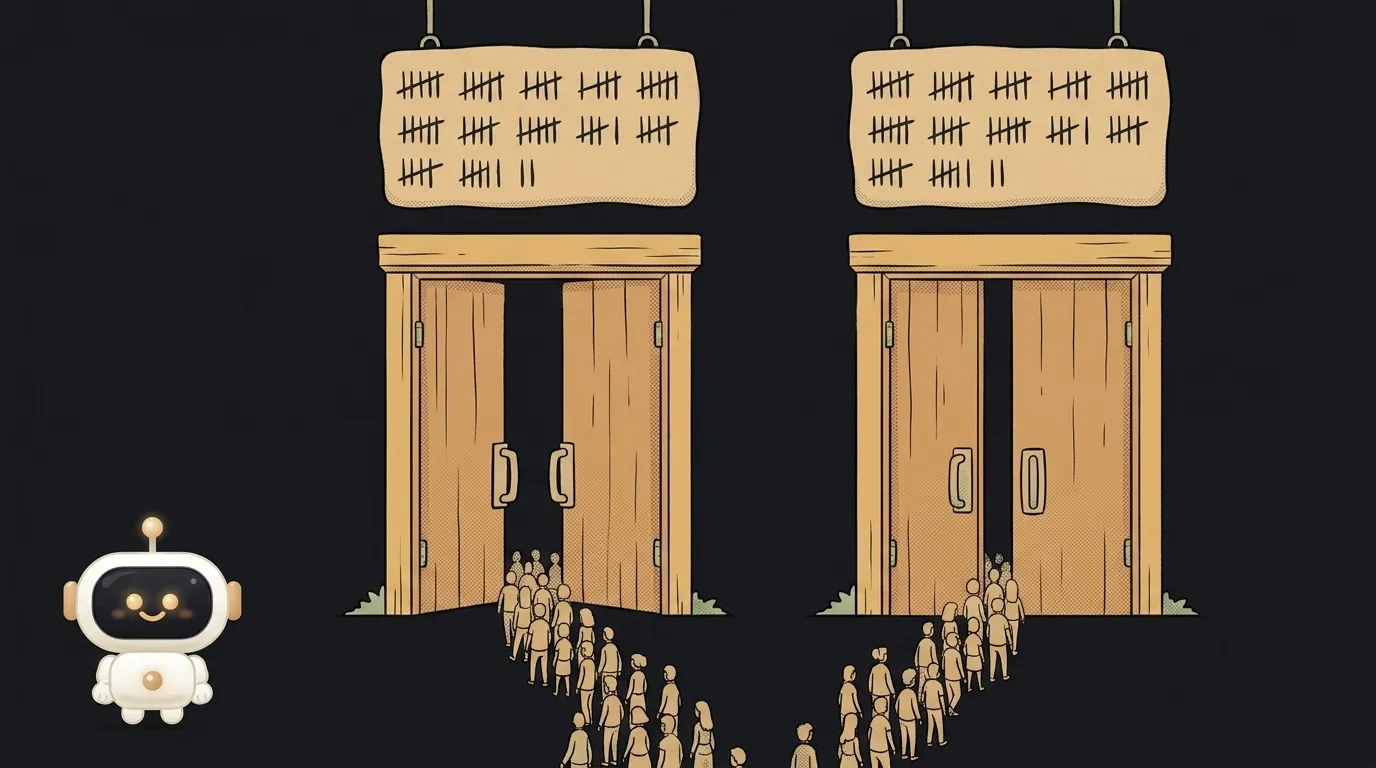
What is an A/B test — and why it lies to you at a hundred visitors
An A/B test checks a change on real people. Here's what it is, how many visitors an honest result needs, and what to do when your traffic is small.

How to add analytics to your site — in 10 minutes, no developer needed
Step by step: how to add analytics to your site, drop in the counter, check the first visit, and see how many people actually show up — in ten minutes.