What is an A/B test — and why it lies to you at a hundred visitors
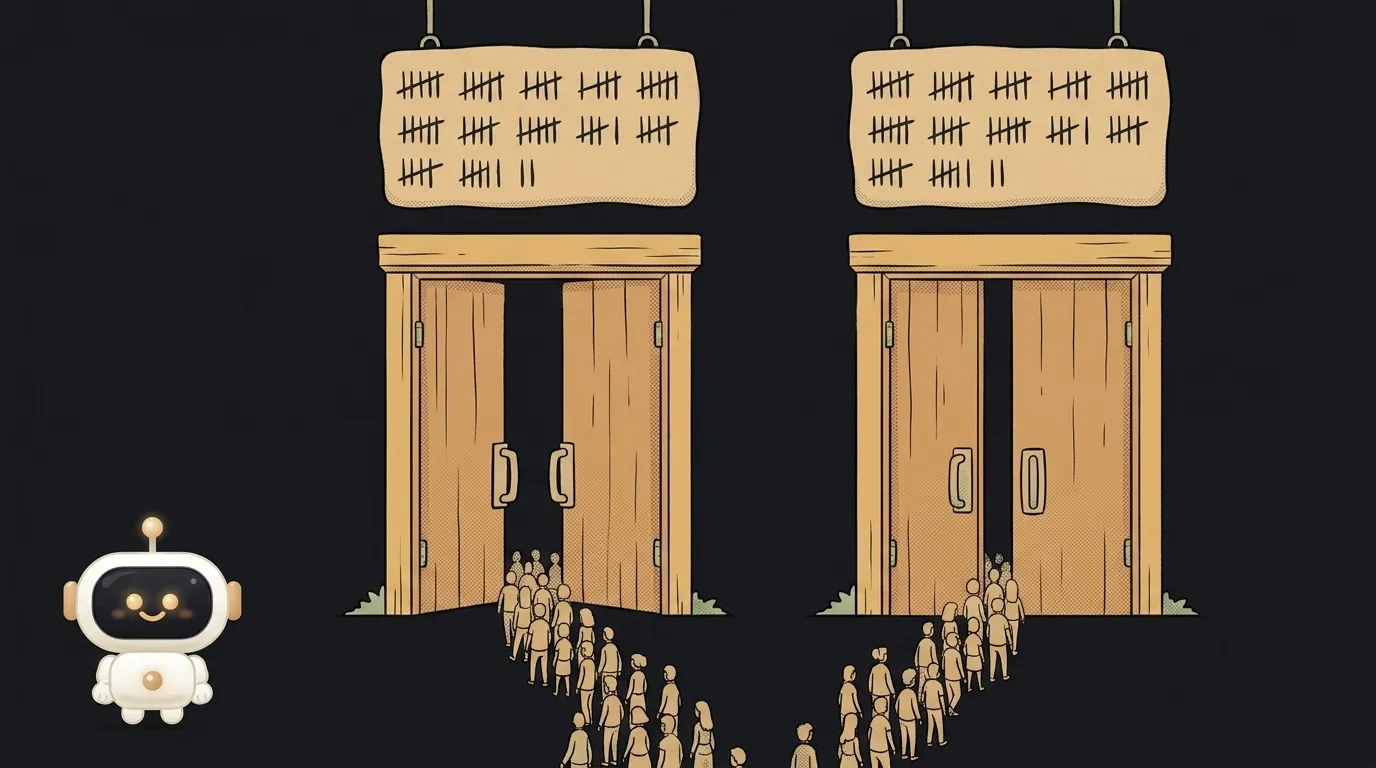
You changed the button color, checked the stats: 4 purchases per 100 visits before, 6 per 100 now. Plus 50%! Winner, ship it.
Now the bad news. To honestly catch a lift from 5% to 6% conversion you need roughly 8,000 visitors per variant. Not 100. Your "6 versus 4" isn't a result, it's noise. Let's do the real math.
What an A/B test is
An A/B test settles a change by measurement instead of argument.
You build two versions of a page: A (as it was) and B (with the change). Visitors are split at random: half see A, half see B. Both groups arrive at the same time, from the same sources. You count which group does the thing you care about more often — purchases, signups, clicks.
The key word is simultaneously. Comparing "last week with the old button" to "this week with the new one" is meaningless: there was a holiday in between, a newsletter, somebody's post. An A/B test removes that interference by letting both versions live under identical conditions.
The switching itself usually runs on a feature flag — the toggle that decides who sees what.
Why a small test lies
Picture a coin. You flip it 10 times and get 7 heads. Is it rigged? No — over ten flips that happens constantly. Flip it 10,000 times and a 70% skew would mean something.
Visitors work the same way. Conversion bounces around on its own, with no help from your button. At small numbers those natural bounces are bigger than the effect you're hunting.
Hence the rule: the smaller the change you want to detect, the more people you need. And the relationship is nasty — quadratic, not linear. Want to catch an effect half the size? Get four times the traffic.
How many visitors it actually takes
Honest numbers at a 5% baseline conversion (standard 95% significance, 80% power), per variant:
- a fifth better (5% → 6%) — you need ~8,200 visitors per variant;
- half again better (5% → 7.5%) — ~1,500 per variant;
- twice as good (5% → 10%) — ~440 per variant.
And about low baselines: if your conversion is 2% rather than 5%, the same relative lift (2% → 2.4%) now needs ~21,000 per variant.
Read those three lines again — that's the whole lesson. At 100 visitors a day, a "one fifth better" test takes over five months. A "twice as good" test takes about nine days.
Small tweaks are nearly impossible to verify honestly. Big changes aren't. So test big things.
What to do when traffic is small
That's the situation of almost every new project — and it isn't a dead end.
- Test big changes, not shades. A different headline, a different price, a different landing page structure produce effects visible at small numbers. A button color doesn't.
- Measure an event that happens more often. Purchases are rare; button clicks are many times more common. A click test gathers data faster. Just remember: more clicks doesn't always mean more money.
- Don't peek daily. If you check every day and stop the moment one side pulls ahead, you're all but guaranteed to catch a random spike. Compute the sample size up front — then wait for it.
- Use qualitative methods too. Five session recordings or five short user conversations explain the "why," which numbers never will.
- Run for at least a week. Monday and Saturday behave differently. A three-day test measures the day of the week, not your button.
Wiring up the measurement is easy: events in your analytics plus a random split into two groups is already a working A/B test, no dedicated service required.
How to split people honestly
There's a trap here that quietly ruins results. If you decide "A or B" with a coin flip on every page load, the same person sees one version, then the other. They get confused and your numbers blur: whose order was that, exactly?
Make the split sticky. The variant is chosen once and remembered — by user id, or by a random number you drop into a cookie on the first visit. From then on, that person always lands in the same group.
And name one primary metric up front. Not "let's see what moves" — something always moves by chance, and you'll call it a win. Write it down before you start: "counting paid orders, running to 8,000 visits per variant." That's the only real defense against fooling yourself.
Another common mistake is launching a test and switching on ads or a newsletter at the same time. New traffic usually behaves differently from your regulars. The test won't break, but the result will be about those new people, not your audience.
What does "statistically significant" mean?
That the result is unlikely to be chance. The usual bar is 95%: roughly one test in twenty still shows a false win. So a lone "significant" result behind an important decision is worth re-running.
Can I test more than two variants at once?
You can, but every extra variant splits your traffic and raises the odds of a fluke winner. On small traffic, comparing two is the honest option.
How long should a test run?
Until the sample size you calculated in advance — and never less than a week. Stopping "when it looks good" is the most popular way to fool yourself.
The AI Architect 2027 course: step by step from computer basics to your own app and first customers. 543 short lessons on your phone.
Read next

Why SSH still asks for a password when your key is set up — 3 causes

How to set up ~/.ssh/config — short server names instead of long commands

Why does SSH disconnect on its own (Broken pipe) — three causes and how to fix them

How to read command help (--help and man) — and find your version's flags in a minute

Why Ctrl+C doesn't stop a program — and how one except line causes it