What is a funnel — and why five 80% steps leave you with 33%
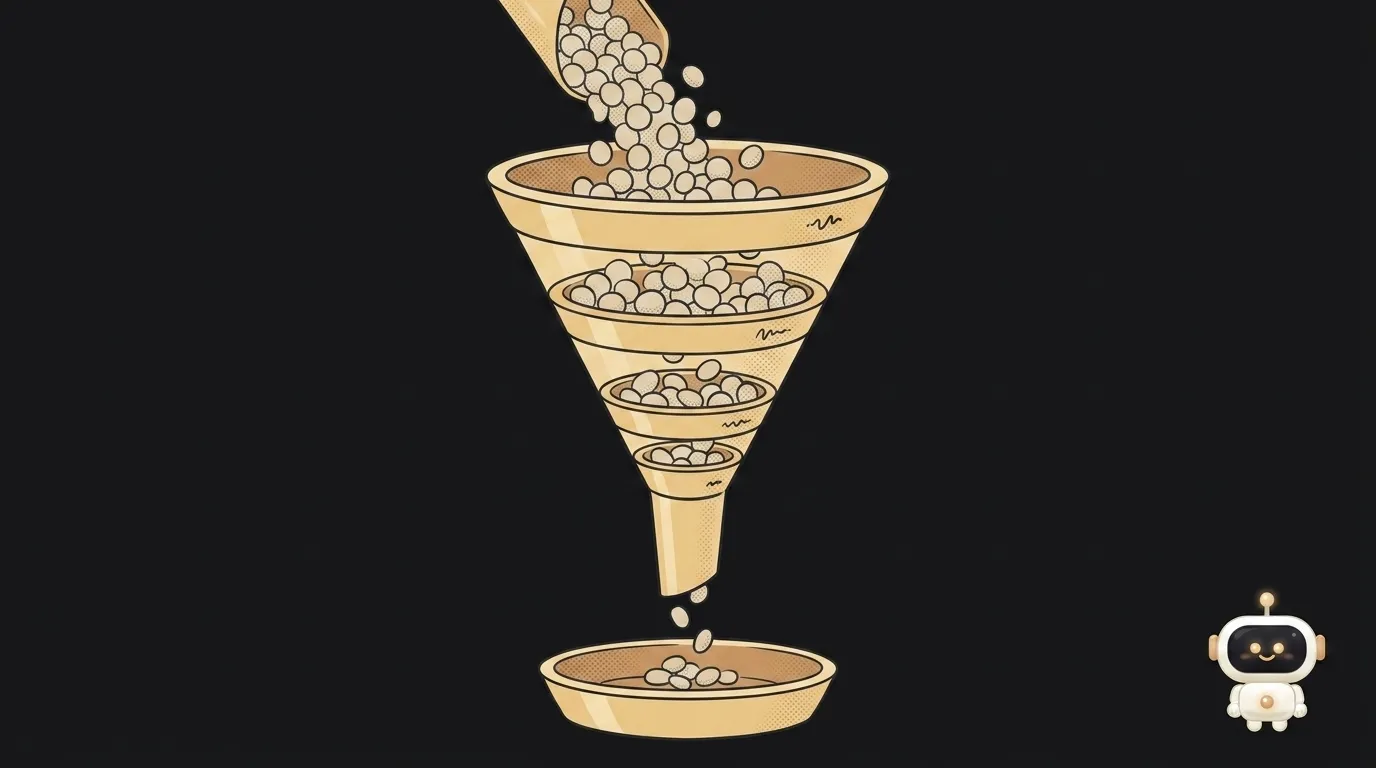
Here's some painful arithmetic. You built a five-step signup, and 80% of people clear each step. Sounds great — eight out of ten, almost everyone.
33% will make it to the end.
Not 80%. Not "roughly 70". A third. Step percentages don't add up and don't average out — they multiply. And until you see that, you'll keep fixing the wrong thing.
What a funnel is
A funnel is your user's path, split into steps, with the number of people at each step.
That's it. No magic. For example:
- landed on the site — 1000
- tapped "Get started" — 600
- entered an email — 300
- confirmed the email — 210
- created a first project — 84
Wide at the top, narrow at the bottom — hence the name. Programmers didn't invent it: the metaphor is over a century old and came out of advertising. But its use to you isn't as a picture, it's as a loss counter: between any two rows you can see exactly how many people dropped out right there.
Notice what's missing from that list. There's no "total visits" and no "time on page". A plain visitor counter answers "how many came". A funnel answers something else: how far did they get.
Why the percentages multiply
This is where intuition breaks. Take my five 80% steps.
80% of everyone reaches step two. Step three is reached by 80% of the people who already reached step two — 80% of 80%. That's 64%. Then 51%, 41%, 33%.
0.8 × 0.8 × 0.8 × 0.8 × 0.8 = 0.33
Each step takes its cut not from the original crowd but from the leftovers. That's why a long funnel kills conversion even without a single "bad" step.
The practical takeaway is blunt: an extra step is expensive even when it's a good one. Drop one screen out of five at the same 80% and you get 41% instead of 33% — a quarter more people at the end. You improved nothing. You just deleted.
Which step to fix first
Second trap here. Look at my funnel again and find the worst transition.
- 1000 → 600 — 60% passed
- 600 → 300 — 50% passed
- 300 → 210 — 70% passed
- 210 → 84 — 40% passed
The last step — "created a first project" — loses the most. Here's why you start there: improvements are measured against what's left.
Lift the first step from 60% to 70% — great work, +10 points. The end result becomes 98 people instead of 84. Plus 14.
Lift the last step from 40% to 50% — same +10 points, same effort. The end result is 105 instead of 84. Plus 21.
And now the real point: the last step is usually easier to fix. Those people already cleared four screens. They're motivated, they want this. If they still leave, you're blocking them with something specific and fixable: an empty screen with no hint, a confusing button, a twelve-field form.
The rule is simple: don't hunt for the lowest percentage anywhere — hunt for the lowest percentage where the person has already invested. A drop on the first screen often just means they weren't your user. A drop on the last screen is your bug.
Build your own funnel in an evening
You don't need diagrams or a separate service. You need four or five events with meaningful names.
- Write the path out in words: what does someone have to do to get value? Not "sign up" — "see their first result".
- Break it into steps. Fewer is better. Past six steps, the multiplication has already beaten you.
- Attach one event with a speaking name to each step:
signup_started,email_entered,project_created. - Wait a week. On five users a funnel shows nothing — the numbers will swing on a single person.
- Compute the transitions between neighbouring steps. Not percentages of the start — percentages of the previous step, or you won't see where it narrows.
What you get: five numbers that point straight at one bottleneck. It's usually not where you expected.
Where you'll run into this
A funnel is half the picture, and it matters which half. It looks at one pass: someone showed up and either made it or didn't. It says nothing about whether they come back tomorrow — that's the other half, retention.
One more thing: a funnel lies if you mix people who arrived at different times. A fresh crowd from an ad and your first friends behave differently, and in a single total they blend into mush. The cure is cohorts — splitting by arrival date.
How many users before a funnel is trustworthy?
At least a few hundred reaching the first step. On twenty visitors, one random drop-off moves a percentage by five points — that's noise, not signal. While traffic is thin, don't look at percentages, look at actual people: where exactly did this one get stuck?
How is a funnel different from conversion?
Conversion is one number: what share made it from start to finish. A funnel is that same conversion, broken out by step. Conversion says "bad". A funnel says "bad right here".
Do I have to buy an analytics service?
No. If you already have a database, your first funnel is a query against your own tables: count how many users have a record for each step. A dedicated tool earns its place when you have many steps and need to slice them — but you don't have to start there.
The AI Architect 2027 course: step by step from computer basics to your own app and first customers. 543 short lessons on your phone.
Read next
Ed25519 vs RSA — which SSH key to choose in 2026

What is sudo — and why it asks for your password, not the admin's

What is a tar.gz file — and why a tar archive can be bigger than the files

What is a command-line flag — and why git commit -ma breaks but -am works
scp or rsync — and why rsync sent 141 bytes instead of two megabytes the second time