What is a breakpoint — and why it has nothing to do with screen width
Here's a funny thing: you've almost certainly debugged with breakpoints already. You just called it console.log.
You know the routine. Add a print, restart, check the console. Not enough — add another. And another. Half an hour later the file is littered with prints, and you still don't know what that variable held one step before the crash.
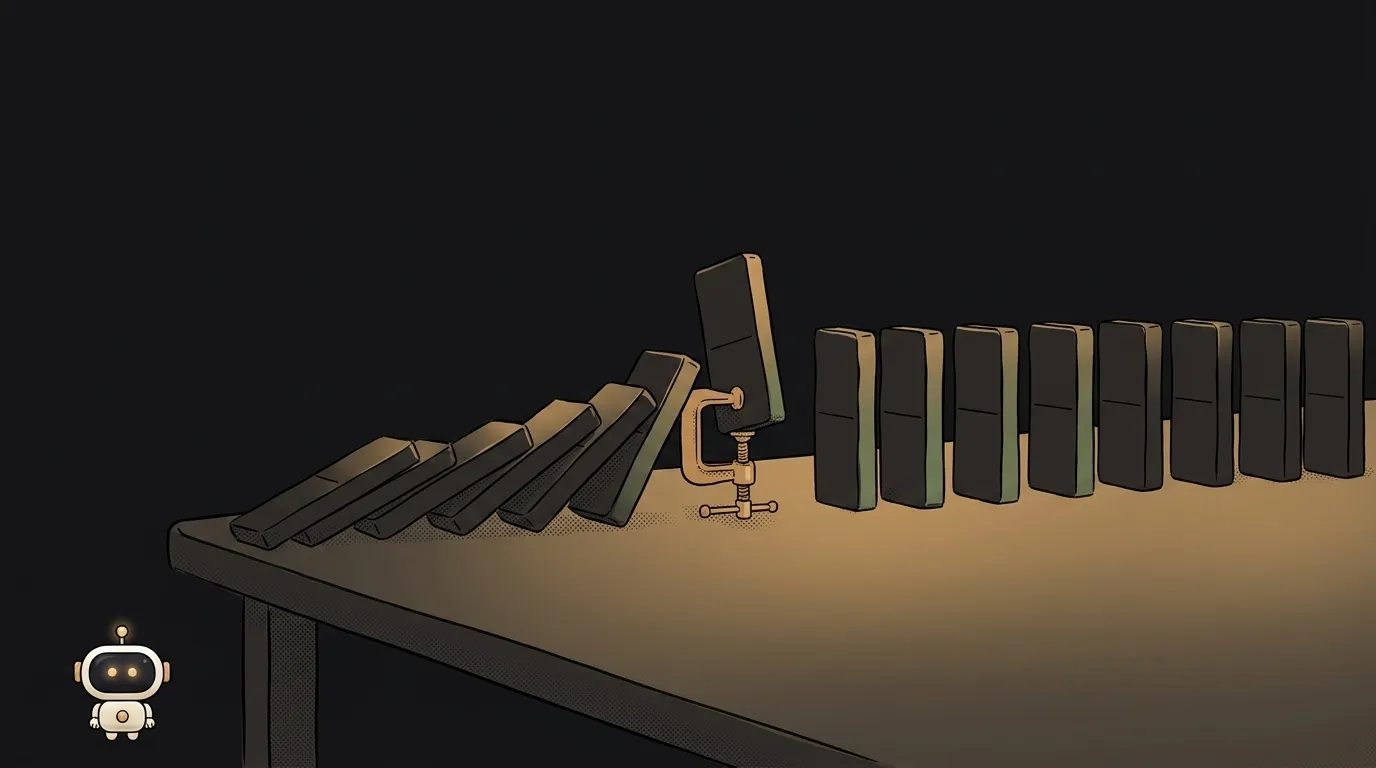
A breakpoint works differently. It doesn't print the past — it stops time.
A breakpoint is a pause on a chosen line
A breakpoint is a marker on a line of code. When execution reaches it, the program freezes. It doesn't crash, it doesn't quit — it just waits for you.
And while it waits, you can see everything at once:
- what every variable holds right now;
- who called this function and from where — a live call stack, not a wall of text in an error;
- what happens next: run one line and watch what changed.
The thing that does the freezing is a debugger. It's already built into your browser and your editor — nothing to install.
Why this beats console.log
console.log answers exactly one question: the one you thought of in advance. Forgot to print the variable you actually need? Restart.
A breakpoint answers any question you come up with while paused. Every value is right there, because the program is literally standing inside that line.
The second difference matters more for beginners: a breakpoint doesn't touch your code. It lives in the debugger, not in the file. No forgotten print ever ships to production.
How to set your first one in a minute
In the browser:
- Open your site and press F12.
- Go to the Sources tab (Firefox calls it "Debugger") and find your file on the left.
- Click the line number — a blue marker appears.
- Reload the page, or click the button that runs that code.
The page freezes and the line lights up. Hover any variable to see its value; the Scope panel on the right lists them all.
There's a no-mouse version too: write debugger; as a line in your code. As long as devtools are open, execution stops right there. Close F12 and the line does nothing.
Four buttons that do the real work
Once you're paused, a row of buttons shows up. Beginners press the first one. The power is in the other three.
- Continue. Let the program run to the next breakpoint.
- Step over. Run the current line and land on the next one. If the line calls a function, it runs quietly — you don't go inside.
- Step into. Drop into that function and see what's happening in there. This is how you hunt a bug when your own line looks correct.
- Step out. Finish the current function and come back to whoever called it. A lifesaver when you accidentally stepped into a library.
Rule of thumb: step over while results match expectations. The moment a line returns something wrong, restart and step into it. That finds the bug in a few steps instead of a print-hunt.
That other breakpoint
If you googled "breakpoint" and landed on articles about phones and tablets, that wasn't a mistake. In web layout, a breakpoint is a screen width where the design rearranges — say 768 pixels, past which the menu folds into a burger.
They share nothing but the word: both are places where something "breaks". Debugging is a pause in time; layout is a threshold in width. Context always tells you which: CSS and media queries mean screens, code and variables mean pauses.
Why bother if the AI writes the code?
That's exactly why. The least useful sentence you can send a model is "it doesn't work". The most useful one is specific: here's the line, here are the variable values on it, here's what I expected.
A breakpoint hands you that material in a minute. From there, debugging with AI gets dramatically faster: the model stops guessing and starts working with facts.
Does a breakpoint slow the app down?
Only while it's set and hitting. Users never see it — it lives in your debugger, not in the site's code. The exception is the debugger; line: remove that from the file before you publish.
What if the browser code is unreadable?
Bundled code often arrives as one giant line. Hit the { } button at the bottom of the Sources panel to unpack it. And if your project ships source maps, the debugger will show your original files instead.
Can I debug outside the browser?
Yes. In VS Code you set breakpoints the same way — click the line number, run with F5. It works for Node.js server code and Python too. Same moves: pause, inspect, step.
The AI Architect 2027 course: step by step from computer basics to your own app and first customers. 543 short lessons on your phone.
Read next
Ed25519 vs RSA — which SSH key to choose in 2026
What is sudo — and why it asks for your password, not the admin's
What is a tar.gz file — and why a tar archive can be bigger than the files
What is a command-line flag — and why git commit -ma breaks but -am works
scp or rsync — and why rsync sent 141 bytes instead of two megabytes the second time