Drop in your spreadsheet and fix the chart with words — the model stops recomputing everything
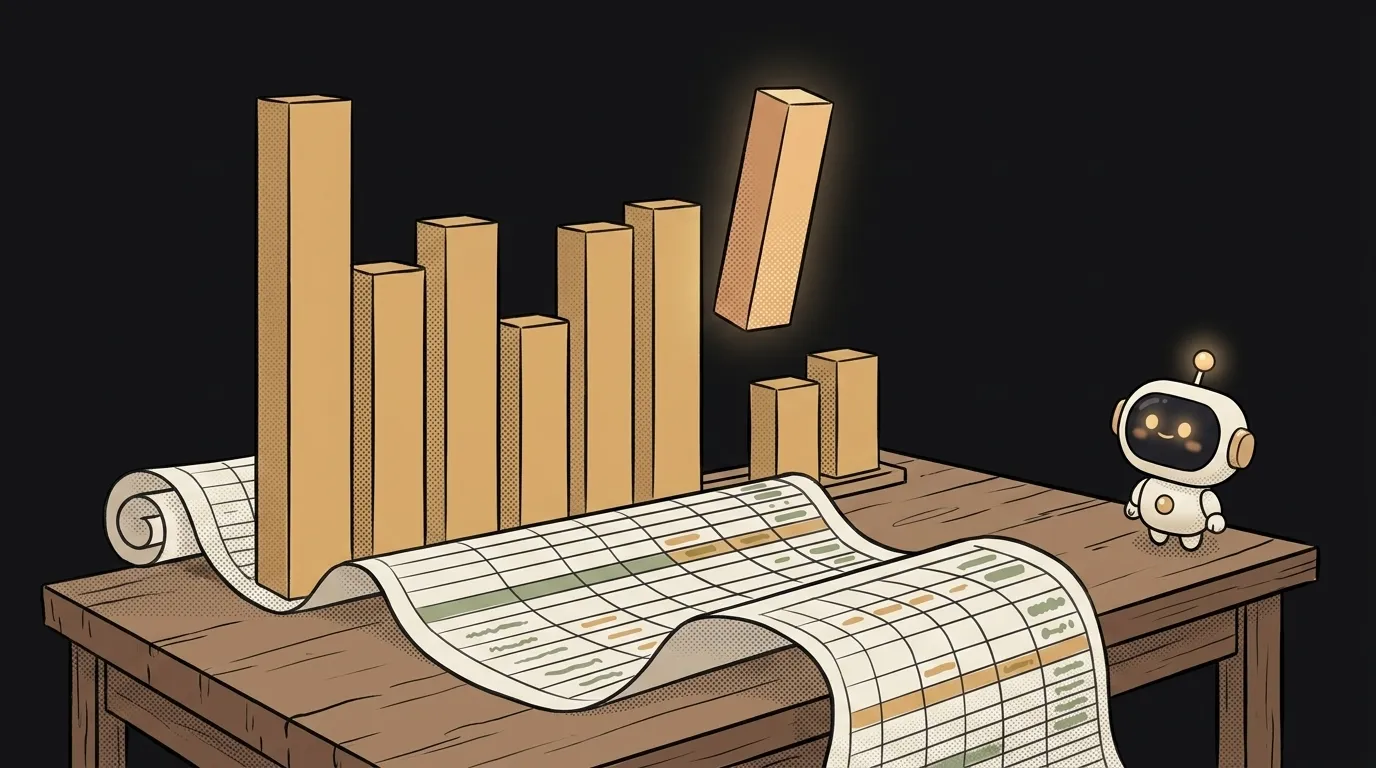
The idea in one line: drop in your own export — spending, steps, workouts, order history — and talk to it. "Show it by month." "Drop the outliers." "Now weekends only." The chart redraws every time.
Why this only works now
Models could already write code and draw charts. That wasn't the problem. The problem was that every next question started from zero.
You ask for "spending by month" and the model writes a script: open the file, parse the dates, group, plot. You say "now without December" — and it writes that same script again. Open again, parse again, group again. As if someone closed your notebook after every line.
On June 18 the SDKs picked up tool version code_execution_20260120 — the one with REPL state persistence. In plain words: the Python notebook stays open. Variables keep living between requests as long as you reuse the same container — pass its id back, and df is still there. So "now without December" is one extra line, not the whole analysis again. On July 9 the same thing (programmatic tool calling) landed in OpenAI's GPT-5.6 — so this isn't one vendor's experiment anymore, it's just how it works now.
Then it gets nicer. The container lives 30 days. After five idle minutes it's checkpointed; you come back a week later, send its id, and it thaws out with your variables intact. pandas, numpy, matplotlib and openpyxl are already installed, so it opens .csv and .xlsx on its own. And it's nearly free: 1,550 hours a month per organization, then five cents per container-hour.
What you'll learn
- State vs. recomputing. Why "the model remembers a variable" isn't about the model's memory at all — it's a live process sitting next to it.
- File in, picture out. How to hand the model your
.csvand get back a finished.pnginstead of a wall of numbers. - The sandbox. What a container is, why code runs there instead of on your laptop, and how to walk back into it tomorrow.
- Conversation instead of a spec. You fix one detail, not the whole prompt, and see the result immediately.
A starter prompt
A weak prompt asks it to "analyze" — you'll get a paragraph of mush about "an upward trend." A strong one sets the mechanics: the file, the tool, the live container, and a picture at the end.
Analyze my spending spreadsheet and tell me what you see.Line three is the whole trick. Without container reuse this collapses back into "write the script again," and the point is gone.
What you end up with
You drop in statement.csv and a couple of seconds later you're looking at monthly bars. You squint and say: "July is wrecking the scale, drop it." The fix lands almost instantly — the model isn't opening the file, the file is already open. "Now color the weekends differently." "Label the three biggest ones." You don't write a line of code, yet you behave like an analyst: hypothesis → look → next hypothesis.
And on Monday you come back, send the same container id, and pick up where you left off. Your df was lying there the whole time, waiting.
Start with your most boring spreadsheet — a bank statement or a steps export. Boring is the feature here: you already know what's in it, so you'll spot instantly whether the model is lying.
Short story-lessons, an agent simulator and daily practice — in our mobile app. Free.
Source: Anthropic — Code execution tool
Read next

Fly down your own route in pixel art — with the buildings standing where they really stand

Cut a jet engine in half — and it works out what just happened to it

A $7 board — and AI taps around your iPhone on its own. No Mac, no jailbreak
47 vacation clips — and an agent cuts them into a video on the beat

Build a “send as-is” button — a model that hands you the email, not advice about it