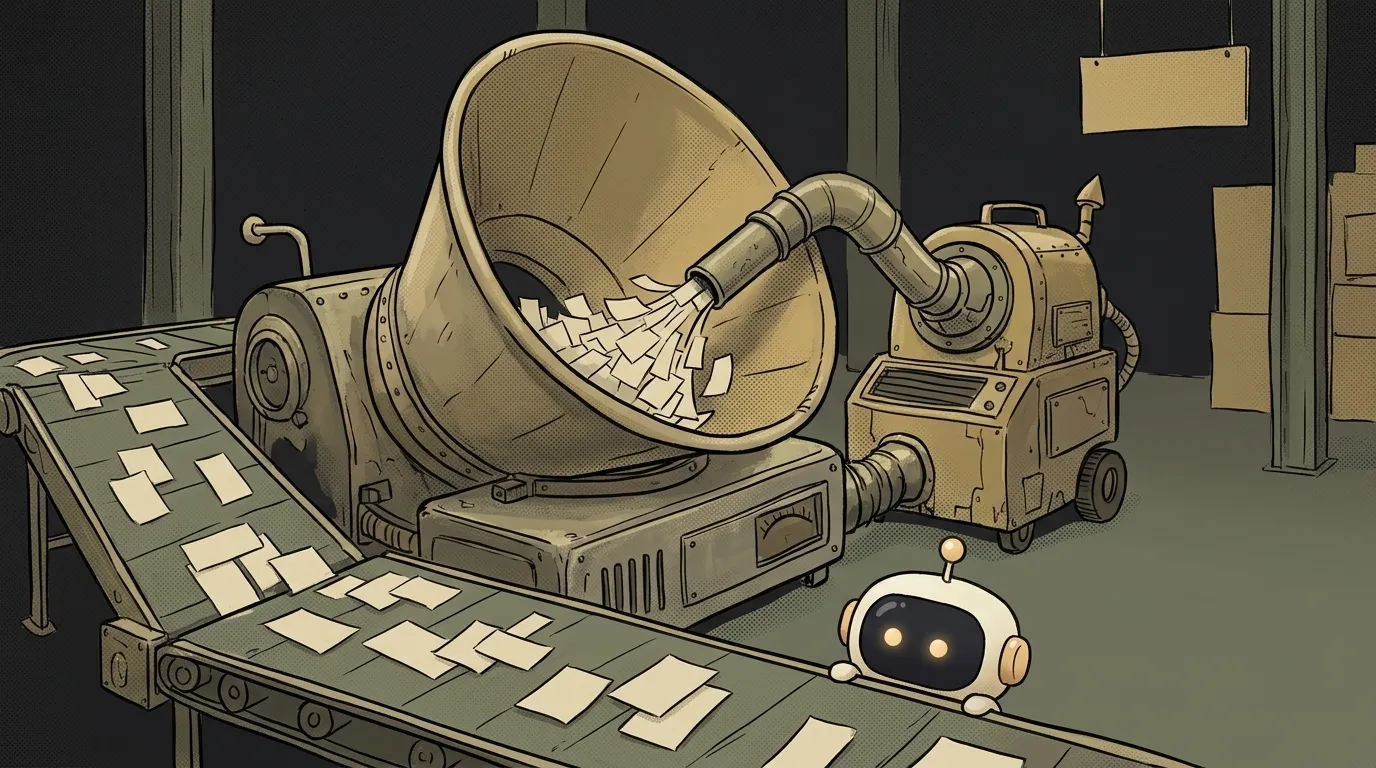
What is observability — and why monitoring never answers the question «why»
Here's a sneaky one. You set up monitoring, everything is green, all the graphs are flat. And then a user writes in: "it took half a minute to load for me." And you can't say why — because you never thought to put a graph on exactly that.
That's the whole difference. Monitoring answers questions you thought of in advance. Observability answers the ones you think of later, once something has already broken.
Monitoring knows the questions ahead of time. Observability doesn't
Monitoring is a set of pre-written questions. "Is the server alive?" "Are we out of memory?" "Are errors above 1%?" You decided to ask them while writing the code. As long as the thing that breaks is the thing you planned for, it works great.
The problem is elsewhere. What breaks is usually what you didn't plan for.
"Why is the response twice as slow for users in Kazakhstan?" "Why does it only lag when the cart has more than 20 items?" You don't have that graph. And you never will — you can't invent those questions in advance.
Observability is when you collect enough data about how the app runs that you can ask a new question without rewriting code and shipping a release. You don't add a new metric — you just ask something of what's already there.
Three signals: logs, metrics, traces
People pile these together as "some kind of logs." They're three different tools for three different questions.
- Logs — "what exactly happened at this moment." Text with details: which user, which request, which error. Rich, but one event at a time. We have a separate piece on logs.
- Metrics — "how much and how often." Numbers over time: requests per minute, average response time, error rate. Cheap to store, easy to graph — but the details are gone. A metric won't tell you who was slow.
- Traces — "where the time went inside one request." A single request broken into timed steps: 5 ms router → 800 ms database → 30 ms template. This is where you see that the culprit isn't "a slow network" but one specific database query.
Simple rule: the metric says what is wrong, the trace says where, the log says why. Starting an investigation in the logs before you know where to look is like flipping through a book at random.
Why an AI app needs this more than a normal one
This is where it gets interesting. Ordinary code is deterministic: same input, same result. It breaks, you reproduce it locally, you fix it.
A model doesn't work that way. The same prompt gives different answers, latency jumps around, and a "bad answer" isn't a 500 — as far as the app is concerned, everything succeeded. There's no error log, because there was no error.
So an AI app has its own signals you have to collect deliberately:
- how many tokens a request burned (that's your bill at the end of the month);
- which model answered — especially if you have a backup one;
- how long each link took: the knowledge-base search, the model call, the post-processing;
- what actually went to the model — the final assembled prompt, not your template.
That last one saves you most often. If you run RAG, then nine times out of ten "the model is being dumb" means "the wrong chunks got stuffed into the prompt." Without a trace you won't see it — you'll be tuning the prompt while the retrieval is at fault.
Where to start: one request id
You don't need to buy a platform and instrument everything. The first step, and it pays off immediately, is an end-to-end request identifier.
Generate a random string on the way in. Put it in every log written along the way. Return it to the user in a response header or in the error text.
That's it. Now when someone says "it's not working for me," you ask for that id, search by it, and get the full story of one request instead of a soup of a thousand parallel ones. That's your first honest trace, hand-rolled.
Tools come later. But this one step gives you 80% of the value.
So monitoring is obsolete now?
No, and this is the part not to mix up. People frame them as rivals when they do different jobs.
Monitoring is the watchman. It watches a handful of pre-chosen numbers and wakes you when one crosses a line. Errors went over 2% — you get a message. It doesn't explain, it notices.
Observability is the investigation. It starts after the watchman wakes you, and answers what actually happened.
Without the first you won't hear about the problem in time. Without the second you'll hear about it and then fix things blind.
Practical takeaway: don't try to build everything at once. Set up one or two honest alerts (site not responding, errors way up) — that's monitoring. And make sure there's something to dig into when they fire — that's observability.
Does observability mean paying for a service?
No. A request id, structured logs in JSON and a couple of counters already are observability, and they cost nothing. Paid services sell convenient search and dashboards, not the data itself. Start free, move when searching starts to hurt.
How is a trace different from a plain log?
A log is one line about one moment. A trace is a chain of steps within a single request, each timed, tied together by a shared id. Roughly: a trace is a log that can answer "and how long did that take" and "what came before."
Do I really need this in a pet project?
Full tracing — no. A request id and recording response time — yes, today: that's ten lines of code that pay for themselves the first time something breaks in production while working fine locally.
The AI Architect 2027 course: step by step from computer basics to your own app and first customers. 543 short lessons on your phone.
Read next
Ed25519 vs RSA — which SSH key to choose in 2026

What is sudo — and why it asks for your password, not the admin's

What is a tar.gz file — and why a tar archive can be bigger than the files
What is a command-line flag — and why git commit -ma breaks but -am works
scp or rsync — and why rsync sent 141 bytes instead of two megabytes the second time